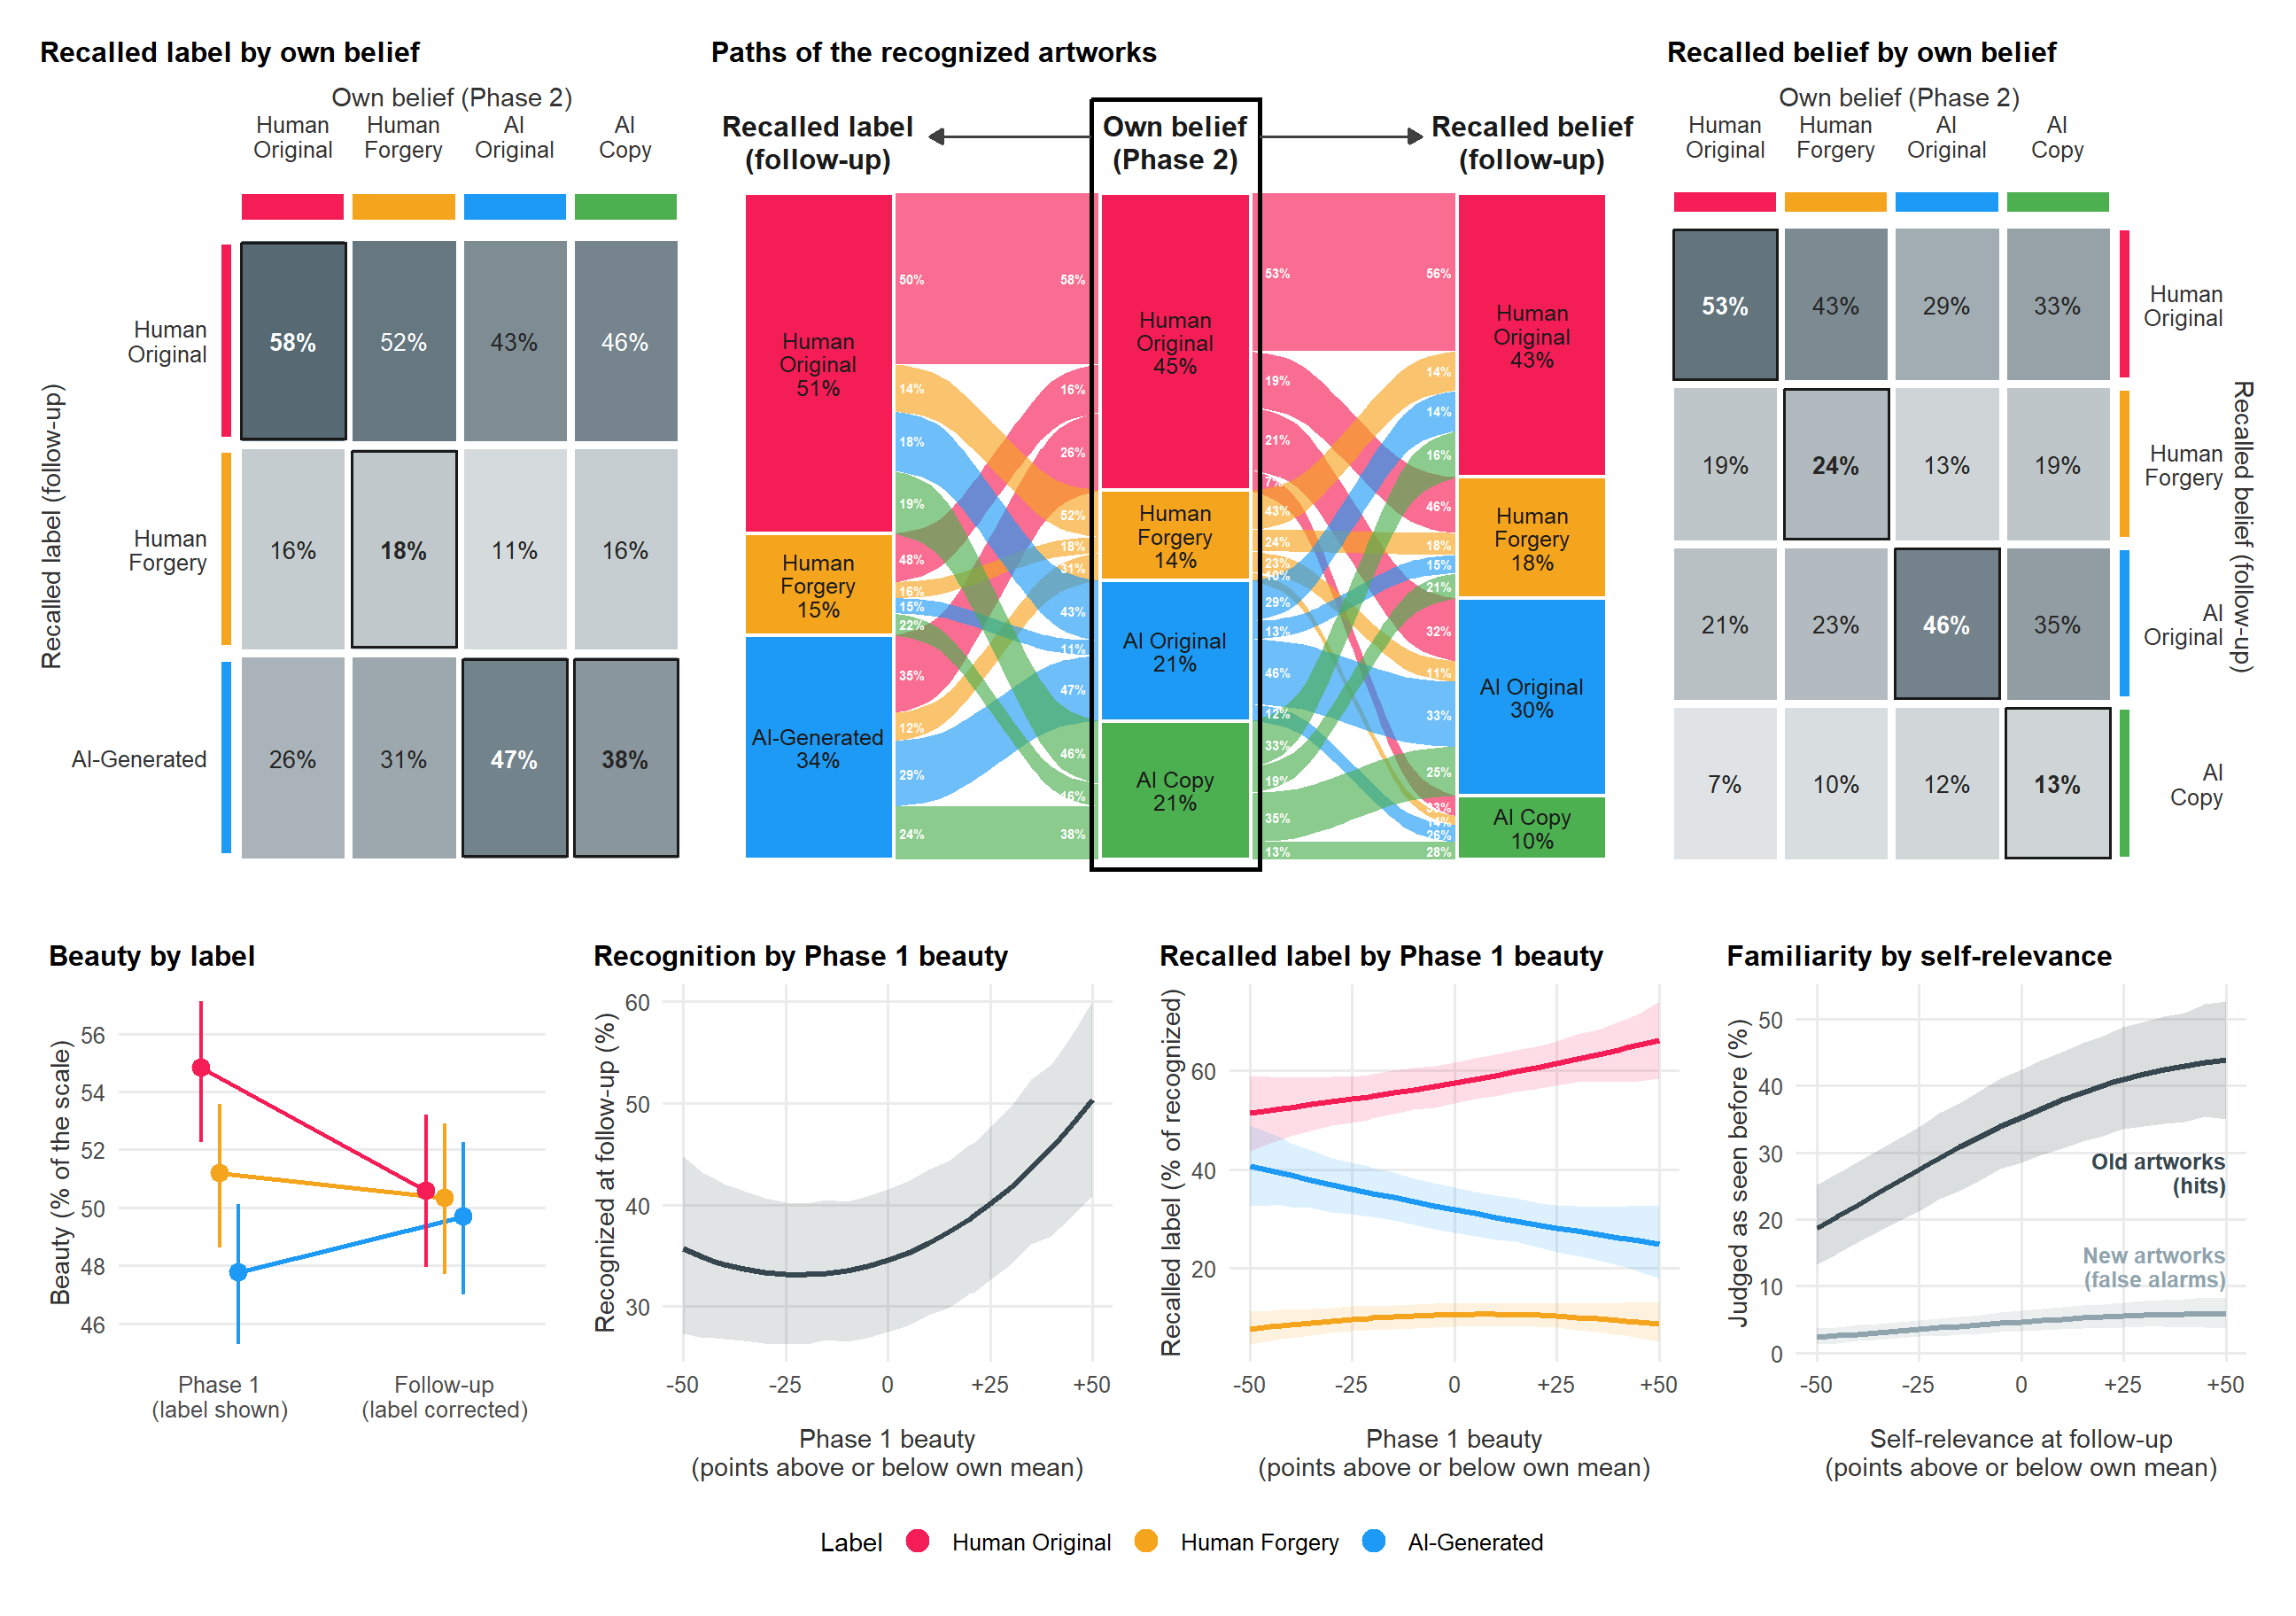
paths <- recognized |>
  count(Recalled = factor(AnswerCondition, labels3), Belief = factor(Belief, lv_belief),
        RecalledBelief = factor(AnswerBelief, lv_belief))
axis_labels <- c(Recalled = "Recalled label\n(follow-up)", Belief = "Own belief\n(Phase 2)", RecalledBelief = "Recalled belief\n(follow-up)")
lodes <- to_lodes_form(paths, axes = c("Recalled", "Belief", "RecalledBelief"), id = "id", diffuse = Belief) |>
  mutate(x = factor(axis_labels[as.character(x)], axis_labels))
w <- 0.42 # box and flow width (wide enough for the labels)
p_allu <- ggplot(lodes, aes(x = x, y = n, stratum = stratum, alluvium = id)) +
  geom_flow(aes(fill = Belief), aes.bind = "flows", alpha = 0.65, width = w) +
  geom_stratum(aes(fill = after_stat(stratum)), width = w, color = "white", linewidth = 0.8) +
  geom_text(stat = "stratum",
            aes(label = paste0(str_replace(after_stat(stratum), "^Human ", "Human\n"), "\n", round(100 * after_stat(prop)), "%")),
            size = 3.3, lineheight = 0.88, color = "grey10") +
  scale_fill_manual(values = cols, guide = "none") +
  scale_x_discrete(expand = c(0.1, 0.1), position = "top") +
  scale_y_continuous(expand = c(0.01, 0.01)) +
  coord_cartesian(ylim = c(0, sum(paths$n)), clip = "off") + # the arrows above the panel must not extend it
  labs(x = NULL, y = NULL, title = "Paths of the recognized artworks") +
  fig_theme +
  theme(axis.text.y = element_blank(), panel.grid = element_blank(),
        axis.text.x.top = element_text(size = base, face = "bold", color = "grey10", lineheight = 0.95))

# Percentages on the flows, read from the drawn flows (one row per flow end): each
# number is the flow's share of the box it touches, i.e. next to the own-belief box
# the % of the artworks of that belief going to each answer (the matrix columns),
# next to the answer box the % of that answer coming from each belief. Labels are
# spread apart within their box when the flows are too thin to hold them.
spread <- function(y, lo, hi, d) {
  o <- order(y); ys <- y[o]; k <- length(ys)
  if (hi - lo < k * d) {
    ys <- (lo + hi) / 2 + (seq_len(k) - (k + 1) / 2) * d
  } else {
    ys <- pmin(pmax(ys, lo + d / 2), hi - d / 2)
    for (i in seq_len(k)[-1]) ys[i] <- max(ys[i], ys[i - 1] + d)
    if (ys[k] > hi - d / 2) {
      ys[k] <- hi - d / 2
      for (i in rev(seq_len(k - 1))) ys[i] <- min(ys[i], ys[i + 1] - d)
    }
  }
  y[o] <- ys
  y
}
N <- sum(paths$n)
d_lab <- 0.019 * N # height of a flow label, in artworks
pad <- 0.015
frame_pad <- 0.025 # gap between the own-belief boxes and the frame around them
ends <- layer_data(p_allu, 1) |> transmute(group, x, stratum = as.character(stratum), ymin, ymax)
boxes <- layer_data(p_allu, 2) |> transmute(x, stratum = as.character(stratum), lo = ymin, hi = ymax)
flows <- inner_join(filter(ends, x == 2) |> rename(belief = stratum),
                    filter(ends, x != 2) |> select(group, x_ans = x, answer = stratum, a_min = ymin, a_max = ymax),
                    by = "group") |>
  mutate(size = ymax - ymin, side = ifelse(x_ans == 1, "left", "right")) |>
  mutate(p_start = 100 * size / sum(size), .by = c(side, belief)) |>
  mutate(p_end = 100 * size / sum(size), .by = c(side, answer))
lab_start <- flows |>
  left_join(filter(boxes, x == 2) |> select(belief = stratum, lo, hi), by = "belief") |>
  mutate(y = spread((ymin + ymax) / 2, lo[1], hi[1], d_lab), .by = c(side, belief)) |>
  mutate(xpos = ifelse(side == "left", 2 - w / 2 - frame_pad - pad, 2 + w / 2 + frame_pad + pad), # outside the frame
         hjust = ifelse(side == "left", 1, 0), p = p_start)
lab_end <- flows |>
  left_join(boxes |> select(x_ans = x, answer = stratum, lo, hi), by = c("x_ans", "answer")) |>
  mutate(y = spread((a_min + a_max) / 2, lo[1], hi[1], d_lab), .by = c(side, answer)) |>
  mutate(xpos = ifelse(side == "left", 1 + w / 2 + pad, 3 - w / 2 - pad), hjust = ifelse(side == "left", 0, 1), p = p_end)
# The own-belief column (boxes and header) framed as the starting point, with arrows
# from the frame to the two answers at the height of the headers (above the panel;
# tuned for the 13.5 x 9.5 in figure)
y_head <- N * 1.085
x_frame <- c(2 - w / 2 - frame_pad, 2 + w / 2 + frame_pad)
p_allu <- p_allu +
  geom_text(data = bind_rows(lab_start, lab_end), aes(x = xpos, y = y, label = sprintf("%.0f%%", p), hjust = hjust),
            inherit.aes = FALSE, size = 2, color = "white", fontface = "bold") +
  annotate("rect", xmin = x_frame[1], xmax = x_frame[2], ymin = -0.015 * N, ymax = 1.14 * N,
           fill = NA, color = "black", linewidth = 0.9) +
  annotate("segment", x = x_frame, xend = c(1.31, 2.69), y = y_head, yend = y_head,
           arrow = arrow(length = unit(2.2, "mm"), type = "closed"), linewidth = 0.6, color = "grey25")

# ---- Confusion matrices on either side of the alluvial: the same data, own
# belief in columns (colour bars on top: the flow colours; columns sum to 100%)
# and the answer in rows, in the order of the adjacent alluvial axis (colour
# bars on the outer side: the box colours); outlined cells: the answer
# consistent with the belief (AI Original and AI Copy -> AI-Generated)
consistent <- c("Human Original" = "Human Original", "Human Forgery" = "Human Forgery", "AI Original" = "AI-Generated", "AI Copy" = "AI-Generated")
matrix_pal <- scales::seq_gradient_pal("#F3F5F6", "#455A64", "Lab")
heat <- function(d, title, ylab, side = "left") {
  nr <- nlevels(d$Answer)
  bar_x <- if (side == "left") c(0.36, 0.44) else c(4.56, 4.64)
  ggplot(d, aes(x = Held, y = fct_rev(Answer))) +
    geom_tile(aes(fill = p), color = "white", linewidth = 1.6) +
    geom_tile(data = filter(d, Correct), fill = NA, color = "grey10", linewidth = 0.7, width = 0.94, height = 0.94) +
    geom_text(aes(label = sprintf("%.0f%%", p), fontface = ifelse(Correct, "bold", "plain"),
                  color = ifelse(farver::decode_colour(matrix_pal(p / 65), to = "lab")[, "l"] < 55, "white", "grey15")), size = 3.6) +
    annotate("rect", xmin = 1:4 - 0.46, xmax = 1:4 + 0.46, ymin = nr + 0.58, ymax = nr + 0.7, fill = cols[lv_belief]) +
    annotate("rect", xmin = bar_x[1], xmax = bar_x[2], ymin = nr:1 - 0.46, ymax = nr:1 + 0.46, fill = cols[levels(d$Answer)]) +
    scale_color_identity() +
    scale_fill_gradientn(colours = matrix_pal(seq(0, 1, length.out = 20)), limits = c(0, 65), guide = "none") +
    scale_x_discrete(position = "top", labels = \(x) str_replace(x, " ", "\n"),
                     expand = if (side == "left") expansion(add = c(0.66, 0.52)) else expansion(add = c(0.52, 0.66))) +
    scale_y_discrete(position = side, labels = \(x) str_replace(x, " ", "\n"), expand = expansion(add = c(0.52, 0.74))) +
    labs(x = "Own belief (Phase 2)", y = ylab, title = title) +
    fig_theme +
    theme(panel.grid = element_blank(), axis.text = element_text(color = "grey20"),
          axis.title.x.top = element_text(margin = margin(b = 4)))
}
dat_m1 <- recognized |>
  count(Held = factor(Belief, lv_belief), Answer = factor(AnswerCondition, labels3)) |>
  mutate(p = 100 * n / sum(n), Correct = consistent[as.character(Held)] == as.character(Answer), .by = Held)
dat_m2 <- recognized |>
  count(Held = factor(Belief, lv_belief), Answer = factor(AnswerBelief, lv_belief)) |>
  mutate(p = 100 * n / sum(n), Correct = as.character(Held) == as.character(Answer), .by = Held)
p_m1 <- heat(dat_m1, "Recalled label by own belief", "Recalled label (follow-up)", "left")
p_m2 <- heat(dat_m2, "Recalled belief by own belief", "Recalled belief (follow-up)", "right")

# ---- Bottom: model-based panels ----
legend3 <- list(scale_color_manual(values = cols, name = "Label", breaks = labels3),
                guides(color = guide_legend(override.aes = list(size = 3.5, linewidth = 1))))
signed <- \(x) ifelse(x > 0, paste0("+", x), as.character(x))
curve_theme <- fig_theme + theme(legend.position = "bottom", legend.title = element_text(size = base - 1),
                                 panel.grid.minor = element_blank(), plot.margin = margin(16, 10, 6, 10))
xlab_beauty <- "Phase 1 beauty\n(points above or below own mean)"

# Beauty under each label in Phase 1 and at follow-up (marginal means of the Beauty / Beauty2 models, 3_models.qmd)
est_beauty <- read_estimates(c("Beauty", "Beauty2"))
dat_a <- bind_rows(mutate(est_beauty$Beauty$means, Session = "Phase 1\n(label shown)"),
                   mutate(est_beauty$Beauty2$means, Session = "Follow-up\n(label corrected)")) |>
  mutate(Session = fct_inorder(Session), Condition = factor(Condition, labels3))
p_a <- ggplot(dat_a, aes(x = Session, y = 100 * Estimate, color = Condition, group = Condition)) +
  geom_line(position = position_dodge(width = 0.25), linewidth = 0.9, show.legend = FALSE) +
  geom_pointrange(aes(ymin = 100 * CI_low, ymax = 100 * CI_high), position = position_dodge(width = 0.25),
                  linewidth = 0.8, size = 0.6, key_glyph = "point") +
  legend3 +
  scale_x_discrete(expand = expansion(add = 0.45)) +
  scale_y_continuous(breaks = seq(44, 58, by = 2)) +
  labs(x = NULL, y = "Beauty (% of the scale)", title = "Beauty by label") +
  curve_theme + theme(panel.grid.major.x = element_blank())

# Recognition by Phase-1 beauty (MemoryAppraisal, joint curve: valence follows beauty)
dat_b <- app$curves |> filter(Type == "joint", Predictor == "Beauty_w", Outcome == "P(recognised)", abs(x) <= 0.5)
p_b <- ggplot(dat_b, aes(x = 100 * x, y = Median)) +
  geom_ribbon(aes(ymin = CI_low, ymax = CI_high), alpha = 0.15, fill = ink) +
  geom_line(linewidth = 1.1, color = ink) +
  scale_x_continuous(labels = signed) +
  labs(x = xlab_beauty, y = "Recognized at follow-up (%)", title = "Recognition by Phase 1 beauty") +
  curve_theme

# "Seen before" by follow-up self-relevance, old (hits, averaged over the three labels) vs new artworks (false alarms):
# MemorySR, the other rating (follow-up beauty) at the participant's mean
est_sr <- read_estimates("MemorySR")$MemorySR
g_sr <- est_sr$grid |> mutate(row = row_number()) |> filter(Type == "unique", Predictor == "SR_w", abs(x) <= 0.5)
rec_draws <- 1 - est_sr$draws[, g_sr$row, "Not recognized"]
dat_c <- bind_rows(lapply(unique(g_sr$x), function(xx) {
  old <- rowMeans(rec_draws[, g_sr$x == xx & g_sr$Level != "New Items", drop = FALSE])
  new <- rec_draws[, g_sr$x == xx & g_sr$Level == "New Items"]
  bind_rows(lapply(list(`Old artworks (hits)` = old, `New artworks (false alarms)` = new), function(v) {
    ci <- bayestestR::hdi(v, ci = 0.95)
    data.frame(Median = 100 * median(v), CI_low = 100 * ci$CI_low, CI_high = 100 * ci$CI_high)
  }), .id = "Type") |> mutate(x = xx)
})) |> mutate(Type = fct_inorder(Type))
# direct labels below each band, right-aligned
dat_c_lab <- data.frame(Type = factor(levels(dat_c$Type), levels(dat_c$Type)), x = 50, y = c(27, 13),
                        label = c("Old artworks\n(hits)", "New artworks\n(false alarms)"))
p_c <- ggplot(dat_c, aes(x = 100 * x, y = Median, color = Type, fill = Type)) +
  geom_ribbon(aes(ymin = CI_low, ymax = CI_high), alpha = 0.18, color = NA, show.legend = FALSE) +
  geom_line(linewidth = 1.1, show.legend = FALSE) +
  geom_text(data = dat_c_lab, aes(x = x, y = y, label = label), hjust = 1, size = 3.3, lineheight = 0.9,
            fontface = "bold", show.legend = FALSE) +
  scale_color_manual(values = c(ink, "#90A4AE"), guide = "none", aesthetics = c("color", "fill")) +
  scale_x_continuous(labels = signed) +
  labs(x = "Self-relevance at follow-up\n(points above or below own mean)", y = "Judged as seen before (%)", title = "Familiarity by self-relevance") +
  curve_theme

# Recalled label by Phase-1 beauty among recognized artworks (MemoryAppraisal, joint curves)
dat_d <- app$curves |>
  filter(Type == "joint", Predictor == "Beauty_w", Outcome != "P(recognised)", abs(x) <= 0.5) |>
  mutate(Answer = factor(str_match(Outcome, "P[(](.*) [|] recognised[)]")[, 2], labels3))
p_d <- ggplot(dat_d, aes(x = 100 * x, y = Median, color = Answer, fill = Answer)) +
  geom_ribbon(aes(ymin = CI_low, ymax = CI_high), alpha = 0.15, color = NA, show.legend = FALSE) +
  geom_line(linewidth = 1.1, show.legend = FALSE) + # same colours and names as the legend of "Beauty by label"
  scale_color_manual(values = cols, guide = "none") + scale_fill_manual(values = cols, guide = "none") +
  scale_x_continuous(labels = signed) +
  labs(x = xlab_beauty, y = "Recalled label (% of recognized)", title = "Recalled label by Phase 1 beauty") +
  curve_theme

# Rows wrapped separately, so that the bottom panels do not align with the wide matrix labels above them
top <- p_m1 + p_allu + p_m2 + plot_layout(widths = c(1.15, 2.3, 1.15))
bottom <- p_a + p_b + p_d + p_c + # the two Phase-1 beauty panels side by side, self-relevance last
  plot_layout(nrow = 1, widths = c(0.95, 1, 1, 1), guides = "collect") &
  theme(legend.position = "bottom")
figure_memory <- wrap_elements(full = top) / wrap_elements(full = bottom) + plot_layout(heights = c(1.25, 1))
ggsave("figures/figure_memory.png", figure_memory, width = 13.5, height = 9.5, dpi = 300, bg = "white")
figure_memory